
Femto Scientific performs temperature and humidity mapping studies using ISO/IEC 17025 accredited, NIST-traceable data loggers for clinical and research laboratories — blood-bank refrigerators, vaccine storage, ultra-low −80 °C freezers, biorepositories, and reagent and specimen storage — with the documented, uniform-performance evidence your CAP, CLIA, and AABB inspectors expect. A daily log shows one point stayed in range; a mapping study proves the whole unit does.
- CAP checklist & CLIA aligned records
- AABB blood-bank storage mapping
- CDC VFC & WHO PQS vaccine storage
- Ultra-low −80 °C & cryogenic mapping
- Biorepository & biobank study support
- Reagent & specimen storage qualification
- Door-open & power-loss recovery testing
- Monitoring-probe placement recommendation
Show your CAP or CLIA inspector that every shelf holding specimens, blood, and reagents is within range.
Temperature Mapping Requirements for Clinical Laboratories
CAP accreditation and CLIA require clinical laboratories to control and document the temperature of every unit that stores reagents, specimens, blood, and vaccines. Daily monitoring proves a unit held its range at the monitored point; a mapping study proves the unit is uniform throughout — that no corner or shelf holding product runs out of specification — and it establishes where the monitoring probe should sit to track the true worst case. Mapping is a spatial qualification study, distinct from calibrating a thermometer and from daily monitoring, and mapping performed with ISO/IEC 17025 accredited, NIST-traceable data loggers is the cleanest way to document it.
CAP & CLIA Storage Control
CAP checklists and CLIA require documented temperature control of storage units and evidence that reagents and specimens are kept within the manufacturer’s instructions-for-use range. Our mapping reports supply the uniformity data, hot-spot and cold-spot identification, and NIST-traceable records a CAP or CLIA inspector expects, formatted to drop into your quality file.
AABB Blood Bank & Vaccine Storage
Blood-bank refrigerators (commonly 1–6 °C), platelet incubators, and plasma freezers carry tight, safety-critical ranges under AABB standards, and vaccine refrigerators and freezers must meet CDC Vaccines for Children (VFC) and WHO PQS expectations. We map these units loaded, with door-open and power-loss recovery, so the report shows how fast each returns to range.
Ultra-Low Freezers & Biorepositories
Ultra-low −80 °C freezers, cryogenic and liquid-nitrogen storage, and multi-unit biorepositories protect irreplaceable specimens. We map the top-to-bottom gradient, characterize warm-up excursions on door or lid opening, and document worst-case locations to support CAP Biorepository Accreditation, ISBER best practices, and GxP sample-integrity requirements.
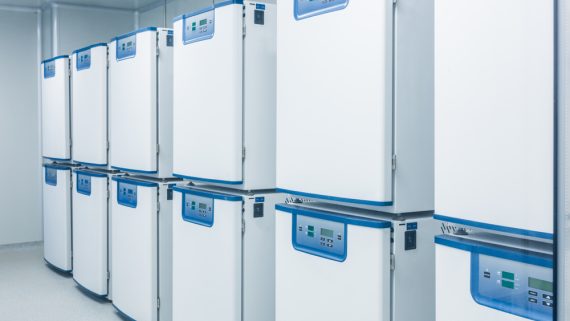
Clinical Storage We Map
From a single blood-bank refrigerator to a bank of ultra-low freezers, we bring the calibrated, NIST-traceable data loggers and the multi-point placement plan your quality program needs to prove uniform performance and pass a CAP, CLIA, or AABB inspection.
- Blood-bank refrigerators & plasma freezers
- Vaccine refrigerators & freezers (VFC/PQS)
- Ultra-low −80 °C & cryogenic storage
- Reagent, specimen & sample refrigerators
- Incubators & controlled-temperature cleanrooms
- Biorepository & biobank storage banks
See the full scope on the temperature and humidity mapping service page, or if you qualify GMP pharmaceutical storage, see our mapping for pharmaceutical & GMP storage.
Clinical CAP & CLIA Temperature Mapping FAQs
Blood-bank and vaccine storage carry tight, safety-critical acceptance ranges, so mapping proves uniformity before the units hold product. Blood-bank refrigerators are mapped against AABB expectations (commonly 1–6 °C with tight uniformity and functioning alarms), platelet incubators around 20 to 24 °C with agitation, and plasma freezers at or below −18 °C (often operated at −30 °C). Vaccine refrigerators and freezers are mapped to CDC Vaccines for Children (VFC) and WHO PQS expectations — refrigerated vaccines typically +2 to +8 °C with a target near +5 °C. Each unit is mapped with multiple calibrated loggers at the corners, center, and near the door, under loaded conditions, and includes door-open and power-loss recovery so the report shows how quickly the unit returns to range. The deliverable supports AABB, CAP, CDC/VFC, and Joint Commission review and identifies where the permanent monitoring probe should sit.
Ultra-low temperature (ULT) freezers — typically operated near −80 °C, and cryogenic/liquid-nitrogen storage down to about −150 °C and below — are mapped with data loggers and sensors rated for those extremes, placed on a grid that captures the top-to-bottom gradient and the shelves nearest the door or lid. Because these units protect irreplaceable specimens, the study characterizes the warm-up excursion and recovery time when the door or lid is opened, and after a simulated power interruption, so a facility knows how long samples can tolerate access. For biorepositories and biobanks, mapping across banks of ULT and cryogenic units documents uniformity and worst-case locations across the whole storage footprint. The report supports CAP Biorepository Accreditation, ISBER best-practice programs, and GxP sample-integrity requirements, and defines where continuous monitoring probes belong.
CAP accreditation checklists and CLIA require clinical laboratories to control and document the temperature of every unit that stores reagents, specimens, blood, and vaccines, and to keep those units within the ranges specified by the manufacturer’s instructions for use or the applicable standard. Daily monitoring logs show a unit stayed in range at the monitored point, but a mapping study is what demonstrates the unit is uniform throughout — that no shelf or corner holding reagents or specimens runs outside specification — and it establishes where the monitoring probe should be placed to track the true worst case. Mapping refrigerators, freezers, ultra-low freezers, incubators, and controlled-temperature cleanrooms and compounding areas gives a CAP or CLIA inspector documented, NIST-traceable evidence of equipment performance. Femto Scientific delivers reports formatted for CAP, CLIA, AABB, and GxP review.
Sensor count is driven by the volume, geometry, and the applicable guidance, not by a single fixed number. A small chamber, refrigerator, or incubator is typically mapped with a minimum of 9 loggers — the eight corners plus the geometric center — while a large walk-in cold room or warehouse may require dozens to more than 100 loggers arranged on a three-dimensional grid. Placement deliberately targets suspected worst-case locations: next to doors and loading docks, near cooling coils and heaters, at the highest and lowest racking levels, close to HVAC supply diffusers and return air paths, and against exterior walls. Additional loggers go at the points where the working monitoring probe and the control sensor are located, so the study can show how representative those fixed sensors are. The placement and its rationale are documented in the protocol before the study begins.
Every mapping study is delivered as an inspection-ready written report suitable for your equipment qualification package. It includes the approved study protocol; a sensor-placement diagram with the rationale for each position; the calibration certificates for the NIST-traceable data loggers used, with pre-study and post-study verification; the complete raw data set; a statistical summary of minimum, maximum, mean, standard deviation, and mean kinetic temperature (MKT) for every sensor; identification of hot spots, cold spots, and gradient zones; analysis of any door-open and power-failure excursions; and a clear pass/fail determination against your stated acceptance criteria. The report also recommends where to place the permanent monitoring and control sensors, and, if a location is out of specification, documents corrective-action recommendations. The package is formatted to drop into an IQ/OQ/PQ qualification file for FDA, USP, WHO, CAP, or CLIA review.
Keep Your Clinical Storage Inspection-Ready
Send us your refrigerators, freezers, ultra-low units, and acceptance criteria — we’ll return a mapping protocol outline, a sensor plan, and a quote that gives your CAP, CLIA, and AABB inspectors the documented, NIST-traceable uniformity evidence they look for.